

March 2026 Charlotte Housing Market: More Choice, Longer Timelines
The Charlotte-area housing market entered spring 2026 with more homes available, longer selling timelines, and relatively stable prices.
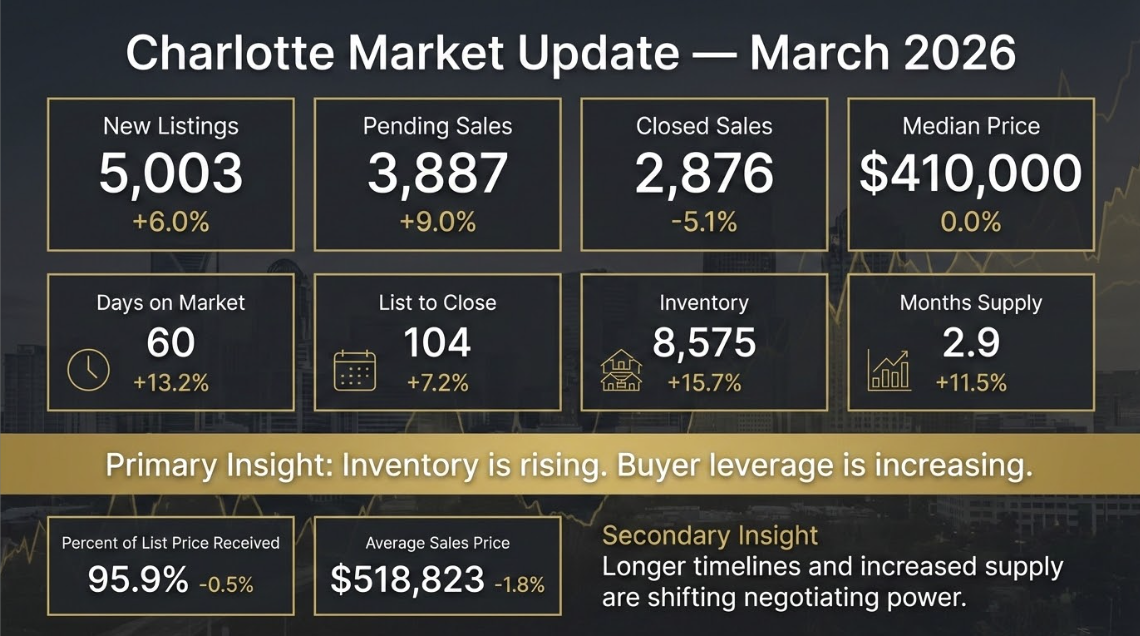
According to the March 2026 Charlotte MSA report from Canopy MLS, active inventory increased 15.7% from the previous year while the median sales price held at $410,000.
Those figures did not indicate a return to the unusually competitive conditions of 2021 and 2022. They also did not, by themselves, support the conclusion that the regional market was crashing. Instead, the data showed buyers gaining additional choices while sellers faced greater competition from other listings.
What Area Does the Charlotte MSA Report Cover?
The March figures represent the broader Charlotte metropolitan statistical area, not solely the City of Charlotte.
The report includes the following counties:
- Cabarrus, Gaston, Iredell, Lincoln, Mecklenburg, Rowan, and Union counties in North Carolina
- Chester, Lancaster, and York counties in South Carolina
Conditions within this ten-county region can vary significantly. A condominium in Uptown Charlotte, a waterfront home at Lake Norman, a property in Fort Mill, and a new-construction home in Union County should not be evaluated using regional averages alone.
Charlotte MSA Inventory Increased 15.7%
The number of homes available for sale increased from 7,412 in March 2025 to 8,575 in March 2026. Months of inventory rose from 2.6 to 2.9 months, an 11.5% increase.
More inventory generally gives buyers additional properties to compare. Depending on the neighborhood, price range, and property type, that may reduce the pressure to make an immediate decision or waive important protections.
For sellers, the increase means a listing is competing against more alternatives. Price, condition, photography, marketing, showing availability, and overall value can have a greater effect on buyer response when inventory expands.
A 2.9-month supply did not represent widespread oversupply across the region. It did, however, reflect a less constrained market than Charlotte-area buyers experienced during the most competitive recent years.
Homes Took Longer to Sell
Average days on market increased from 53 days in March 2025 to 60 days in March 2026, a 13.2% change. Cumulative days on market increased from 60 to 73 days.
The average list-to-close timeline also expanded from 97 to 104 days. This measurement includes both marketing time and the period between contract and closing.
Longer timelines make the opening weeks of a listing especially important. A home that enters the market above current buyer expectations may lose early visibility and require a later price adjustment.
What Longer Selling Times Mean for Sellers
- Pricing should reflect recent comparable sales and active competition
- Property preparation should be completed before photography and launch
- Online presentation needs to communicate the home's condition and value clearly
- Showing feedback should be monitored for repeated concerns
- Price adjustments should be based on evidence rather than emotion
Pending Sales Increased While Closed Sales Declined
Buyer activity did not disappear as inventory grew. New listings increased 6% year over year to 5,003, while pending sales increased 9% to 3,887 contracts.
Closed sales declined 5.1%, falling from 3,030 to 2,876 transactions. Closed sales reflect contracts negotiated during earlier weeks, while pending sales provide a more recent indication of contract activity.
The increase in pending sales suggested that buyers remained active during March. It did not guarantee that future closed sales would increase because financing, inspections, appraisals, and other issues can affect whether a pending transaction reaches closing.
Charlotte MSA Home Prices Remained Relatively Stable
The median sales price remained unchanged at $410,000. The average sales price declined 1.8%, from $528,450 to $518,823.
Year to date, the median sales price increased 1.1% to $406,500, while the average price declined 0.5% to $508,204.
Median and average prices can move differently because they measure the market in different ways. The average is more sensitive to changes in the number of luxury or lower-priced homes sold during a particular period.
Neither figure indicates what happened to every property. Neighborhood, condition, renovations, property type, lot, school assignment, and recent comparable sales remain more useful when estimating an individual home's value.
Sellers Received 95.9% of Their Original List Price
Sellers received an average of 95.9% of their original asking price in March 2026, compared with 96.4% one year earlier.
This measurement does not account for seller concessions or down payment assistance. The final financial outcome may also be affected by repair credits, closing-cost contributions, rate buydowns, and other negotiated terms.
The slight decline suggests that buyers had additional room to negotiate on some properties, particularly listings that were overpriced, needed repairs, or had remained available longer. It does not mean that every seller accepted 4.1% below asking price.
What the March 2026 Market Meant for Buyers
Buyers generally had more options than they did one year earlier, but opportunities varied by location and property type.
Potential advantages included:
- More listings to compare
- Additional time for property evaluation in some segments
- Greater potential to negotiate repairs or closing expenses
- More leverage on listings with extended market time
- Less pressure to overlook property-specific concerns
Buyers still needed to consider mortgage rates, homeowners insurance, property taxes, homeowners association expenses, maintenance, and available cash before deciding whether a home was affordable.
What the March 2026 Market Meant for Sellers
Stable median pricing showed that buyers continued purchasing homes throughout the Charlotte region. However, longer market times and growing inventory meant sellers needed a more precise strategy.
A competitive listing plan should include:
- Property-specific pricing based on current data
- Professional photography and digital presentation
- Thoughtful repairs, cleaning, and preparation
- Convenient showing availability
- A plan for responding to inspection and concession requests
Homes can still generate strong interest when the price, condition, and location align with buyer expectations. Results should be evaluated within the property's neighborhood and price range rather than against regional statistics alone.
Frequently Asked Questions
Was Charlotte becoming a buyer's market in March 2026?
The Charlotte MSA was moving toward greater balance, but 2.9 months of inventory did not indicate broad oversupply. Some neighborhoods and property types offered buyers meaningful leverage, while others remained competitive.
Were Charlotte-area home prices falling?
The March median sales price was unchanged year over year at $410,000. The average declined 1.8%, but changes in the mix of homes sold can influence that figure. Property-specific values may move differently from regional averages.
Why did pending sales rise while closed sales declined?
Pending sales measure recently accepted contracts, while closed sales generally reflect agreements negotiated several weeks earlier. The two figures often move differently during periods when activity is changing.
Does 95.9% of original list price mean buyers received a 4.1% discount?
Not necessarily. It is an average across the MSA and does not include seller concessions or down payment assistance. Some homes sold above asking price, while others required reductions before receiving an offer.
Planning to Buy or Sell in the Charlotte Area?
Regional statistics provide useful context, but an effective real estate strategy should reflect the property's neighborhood, price range, condition, and competition. Schedule a consultation with Stone Realty Group for a local market analysis tailored to your buying or selling goals.
Check out this article next